When working with security operations center (SOC), Wazuh gives you powerful alerting and monitoring capabilities. By default, Wazuh focuses on alerts, but it also supports archives. This is a feature that allows you to store and access all event logs, not just alerts. Wazuh alerts only show events that trigger defined rules, but sometimes you need complete logs for deeper analysis. That’s where enabling Wazuh archives helps.
In this guide, I’ll walk you through how to enable archives in Wazuh, configure Filebeat to ship them, and visualize them in wazuh. You will able to see wazuh-archives-* in the index pattern.
Why Enable Wazuh Archives in index pattern?
While Wazuh alerts are great for spotting security issues, archives provide the full raw log history. This is invaluable for:
- Incident response – reviewing what happened before and after an alert.
- Forensics – digging deeper into suspicious activity.
- Compliance audits – demonstrating complete log retention.
Step-by-Step Guide to Enabling Wazuh Archives
-
Enable Archives in the Wazuh Manager
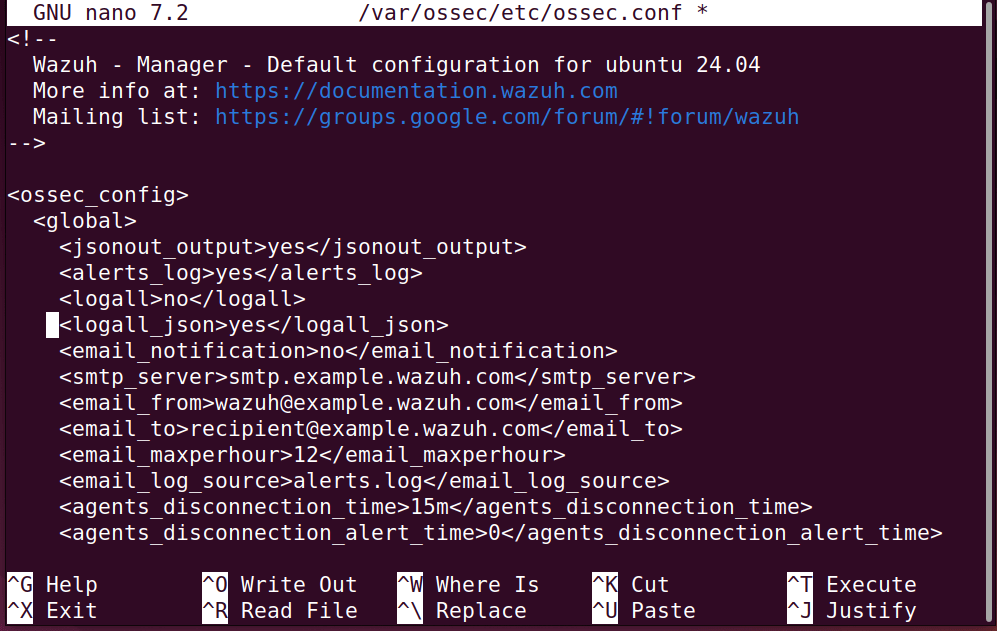
First, you need to tell the Wazuh Manager to store all logs, usually in JSON format. Open and edit the Wazuh Manager configuration file:
sudo nano /var/ossec/etc/ossec.conf
Inside the <global> tag, set the following:
<logall_json>yes</logall_json>
-
Configure Filebeat to Ship Archive Logs
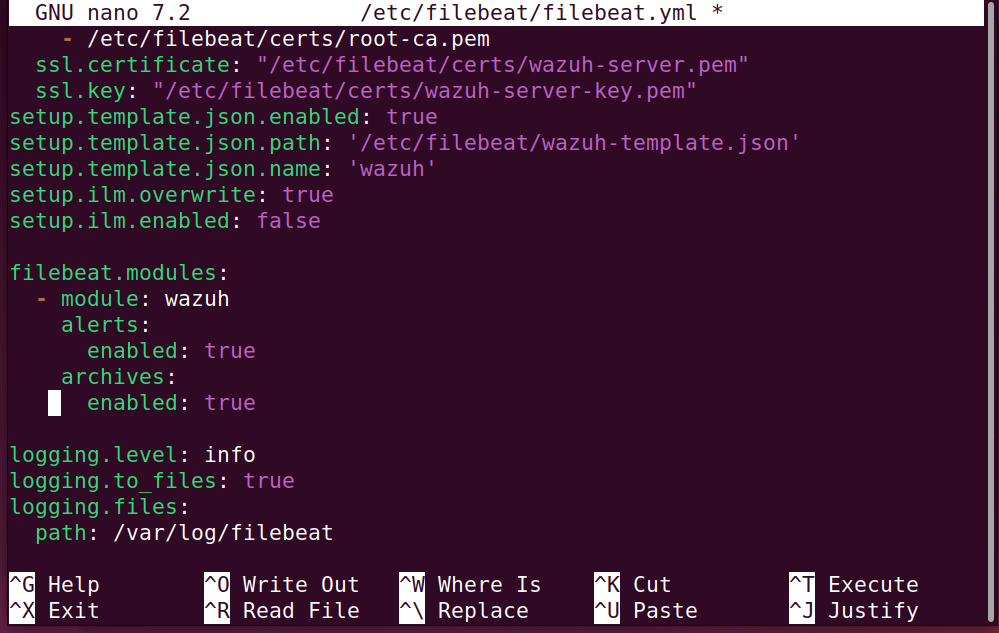
Next, you need to configure Filebeat so it knows to forward the archive logs to your indexer. Open the Filebeat configuration file:
sudo nano /etc/filebeat/filebeat.yml
Enable archives under the wazuh module. Under the filebeat.modules section, locate the wazuh module and change the archives setting to true:
filebeat.modules:
  - module: wazuh
    alerts:
      enabled: true
    archives:
      enabled: true   # Change to true
-
Restart Services
To apply the configuration changes, you must restart both the Wazuh Manager and Filebeat services:
sudo systemctl restart wazuh-manager
sudo systemctl restart filebeat
-
Configure the wazuh-archives-* Index Pattern in Wazuh Dashboard
Now that your logs are being archived and shipped, you need to tell the Wazuh Dashboard how to visualize them. Follow these steps to create your new index pattern:
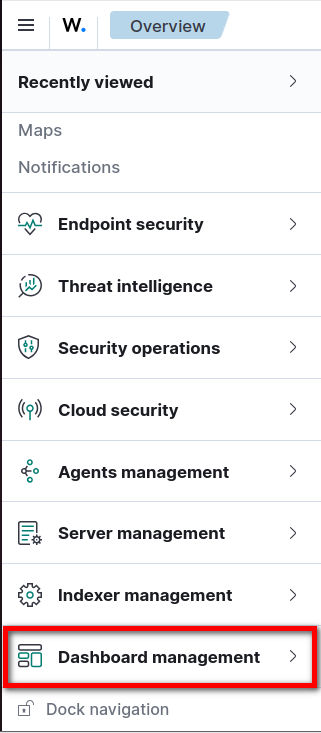
- Click on the ☰ Hamburger menu → Dashboard Management.
- Select Index Patterns → Create Index Pattern.
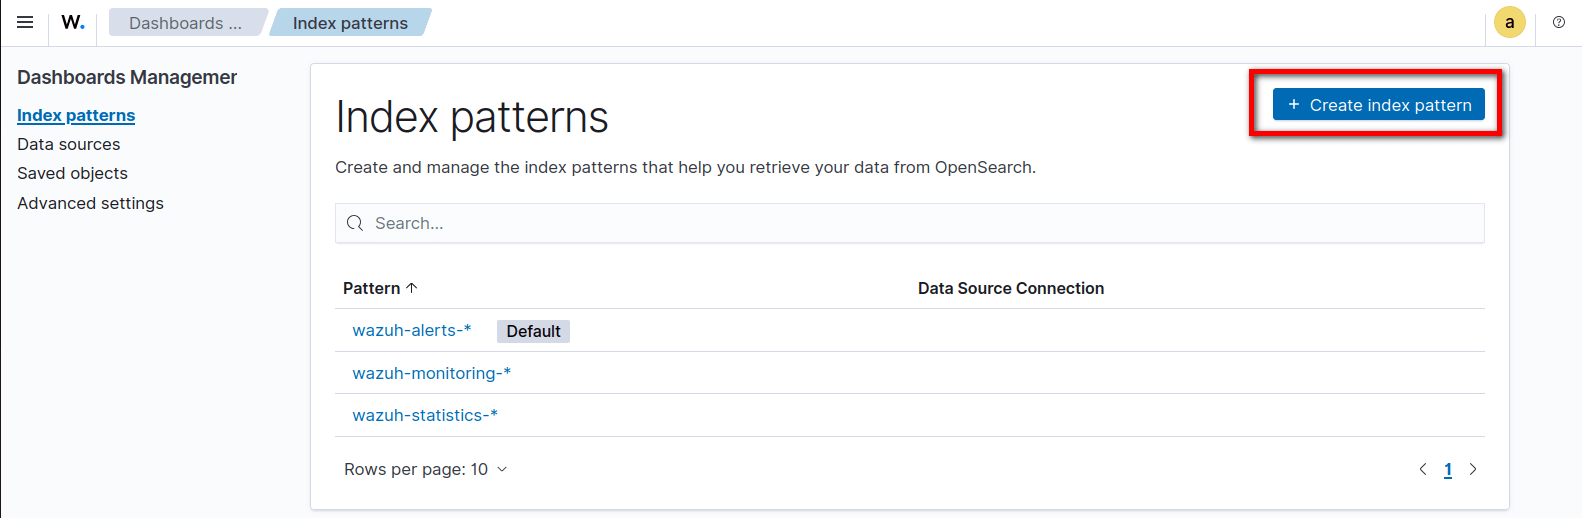
- For the index pattern name, enter: wazuh-archives-*
- Turn on Include system and hidden indices.
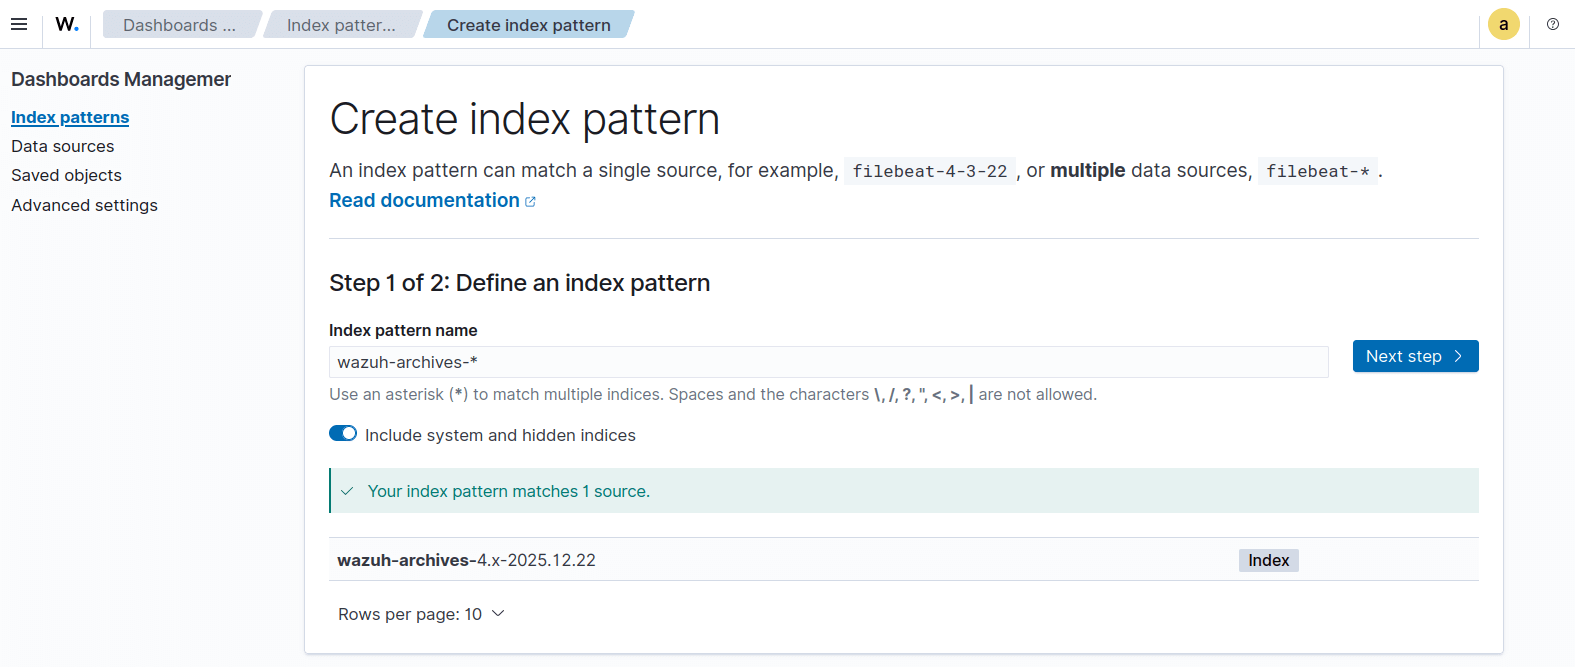
Wazuh Index Pattern Name
- Choose @timestamp as the time field.
- Click Create index pattern.
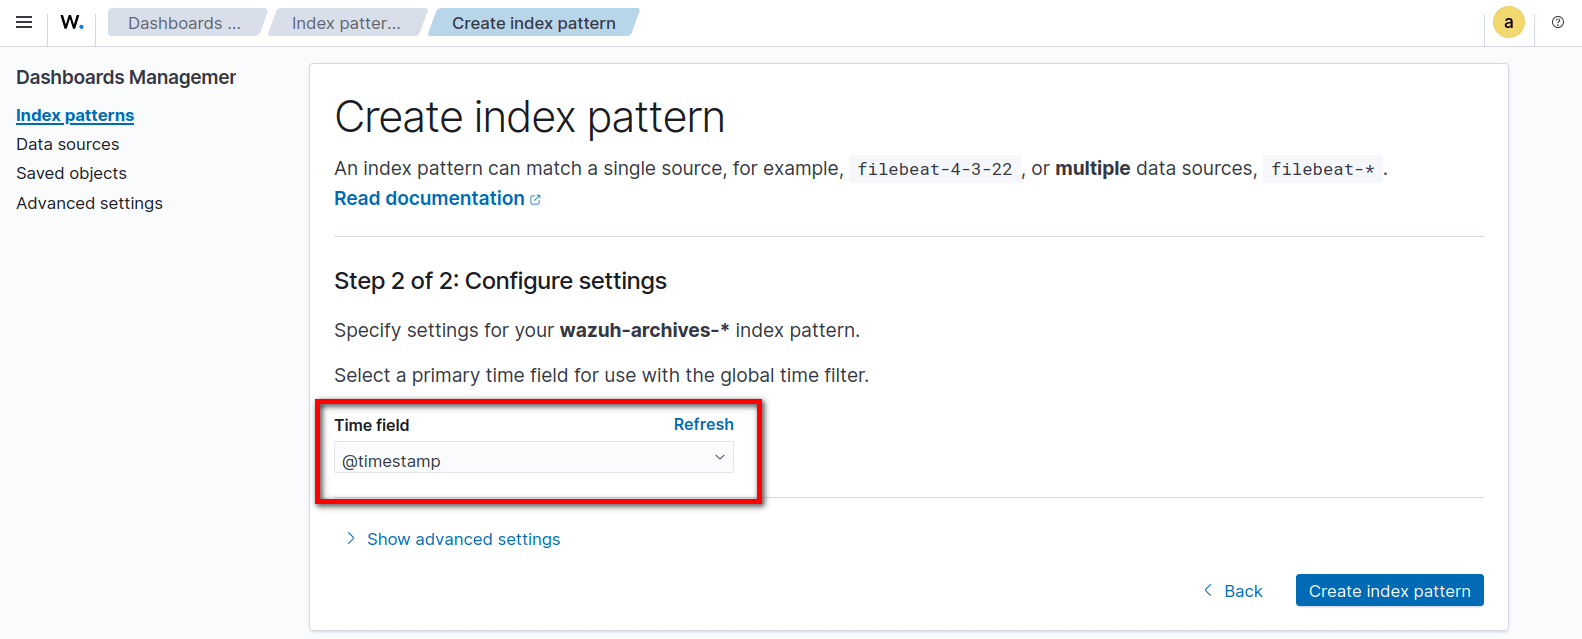
Timestamp
- Now wazuh-archives-* will appear as an available index pattern in the Wazuh Dashboard.
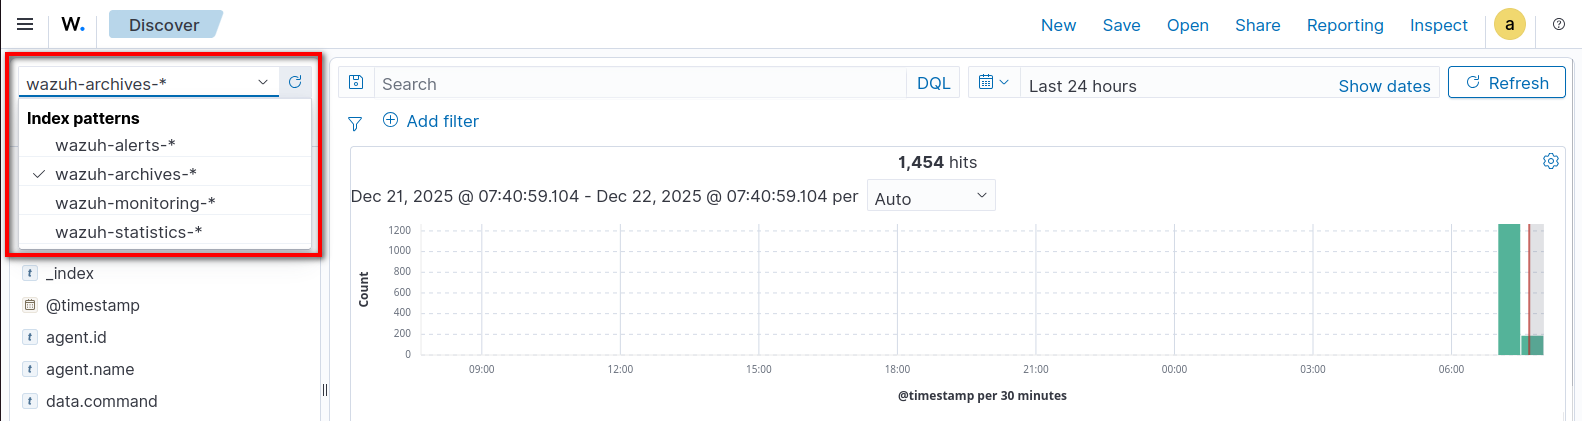
Wazuh Archives in Dashbord
Conclusion
Enabling Wazuh archives and setting up the wazuh-archives-* index pattern is a crucial step for any Security Operations Center. While Wazuh’s default alerts are excellent for notifying you of immediate threats, having access to your complete raw log history is what truly empowers you to conduct thorough incident responses, perform deep-dive forensics, and easily meet strict compliance requirements. By following these steps, you’ve upgraded your Wazuh deployment from a standard alerting system into a comprehensive log management and analysis platform.


Subscribe To Our Newsletter
Join our mailing list to receive the latest news and updates from our team.
You have Successfully Subscribed!