What Is Event Tracing for Windows (ETW)?
Event Tracing for Windows (ETW) is a powerful, built-in logging and tracing framework in the Windows operating system. ETW enables efficient collection, logging, and analysis of detailed events from both user-mode applications (like software running in user space) and kernel-mode components (such as device drivers or core OS functions). ETW provides deep insights into what is happening across the operating system. It captures detailed system activities, including system calls, process lifecycles, registry/file changes, and network operations, offering deeper insights than traditional Windows Event Logs.
With ETW, defenders and analysts can go far beyond traditional log sources (like Windows Event Logs) and gain access to system calls, process lifecycle events, registry/file modifications, network activity, and more.
ETW vs. Event Viewer
ETW itself is the mechanism that generates, collects, and organizes events. Event Viewer is just one interface to read some of those events. Not all ETW events appear in Event Viewer. Many high-frequency or technical events are only visible via ETW sessions or consumers like PerfView, Windows Performance Recorder, or custom scripts.
Core Concepts: User-Mode vs. Kernel-Mode
User Mode Applications:
Software that runs in user space with limited privileges. It interacts with the operating system through APIs and system calls rather than accessing hardware or protected memory directly. This model provides isolation and improves reliability.
Examples:
- Applications such as Word, Chrome or Firefox, Zoom, Spotify, Photoshop
- User mode system processes such as explorer.exe, notepad.exe, calc.exe
- User mode services such as Windows Update wuauserv and SQL Server sqlservr.exe
Kernel-Mode Drivers:
Kernel-mode drivers are software components that run in the operating system’s kernel space with high privileges, directly interacting with hardware or core OS functions.
Examples:
- Device Drivers: (Allows the OS to “talk” to hardware)
- nvlddmkm.sys (NVIDIA GPU Driver)
- ndis.sys (Network Driver Interface Specification)
- disk.sys (Storage Volume Driver)
- File System Drivers: (Manages how files are read/written)
- ntfs.sys (NTFS File System Driver)
- fastfat.sys (FAT File System Driver)
- Security & Filter Drivers: (Can intercept I/O and monitor system activity)
- WdFilter.sys (Windows Defender Antivirus Filter Driver)
- FltMgr.sys (File System Filter Manager, which 3rd-party security tools use)
ETW Architecture Components: How It Works
The 4 Core Components:
- Providers: Generate and publish events. (Publishers).
- Controllers: Start, stop, and configure trace sessions. They also enable specific providers, telling them which session to send their events to.
- Sessions: Act as the central buffer (in kernel memory or a file) that receives and queues the events from all active providers.
- Consumers: Connect to a session (either in real-time or by reading its log file) to read and process the collected events. (Subscribers).

Fig: ETW Architecture
Source: https://learn.microsoft.com/en-us/windows-hardware/test/weg/instrumenting-your-code-with-etw
ETW Workflow:
- A controller starts a trace session.
- The session uses in-memory buffers to collect event data.
- The controller enables providers for the session, instructing them to write their events to it.
- Providers generate events and write them into the session’s buffers.
- A consumer can read those events in real time for analysis.
First, a controller starts a trace session. The session then uses a buffer to hold event data. The controller activates providers, directing them to log their events to that session. As providers generate events, the session collects them. Finally, a consumer reads the events from the session for analysis.
Understanding the Two Primary ETW Data Pipelines
To master ETW, it’s crucial to distinguish between its two primary data pipelines. Both originate from a Provider, but their destination and purpose are very different.
The Tracing Flow: Provider → Session → (Real-time Consumer or File)
This is the core, high-performance path designed for deep, real-time analysis or later troubleshooting.
A Provider (e.g., Microsoft-Windows-Kernel-Process) sends events to an active Session. This Session acts as a high-speed kernel buffer. From here, the data can go to two destinations, often simultaneously:
- A) Real-Time Consumer (Live Feed): The session streams events directly to a “listening” application. This is used by security agents (EDRs) and monitoring tools for live analysis.
- B) Log File Consumer (Offline Analysis): The session writes the event data to a binary .etl file. A Consumer (like PerfView or tracerpt.exe) can then open this file for a deep, post-mortem analysis.
The Logging Flow: Provider → Channel → (Event Viewer or Log Collector)
This is the more traditional “logging” path that integrates with the Windows Event Log service.
- A Provider (e.g., Microsoft-Windows-PowerShell) is configured to send specific events to a named Channel (e.g., Microsoft-Windows-PowerShell/Operational).
- The Windows Event Log service captures these events and saves them persistently in a structured .evtx file.
- This log is then read by the Event Viewer, queried by PowerShell (Get-WinEvent), or forwarded by log collectors (like a SIEM agent) for auditing.
ETW Architecture Components Explained
Providers
Providers are components that generate events and send them to ETW sessions. It can be a user mode application, a system component, or a kernel mode driver. Providers log information about specific activities such as process creation, file or registry changes, or network operations. Each provider is identified by a unique GUID and can be enabled or disabled by a controller for a specific session. Providers define the types of events they can emit and include metadata such as event IDs, levels, and keywords. Providers are also known as publishers. For example, a user mode application provider is Microsoft-Windows-PowerShell (used by PowerShell), while a kernel mode provider is Microsoft-Windows-Kernel-Process (used by the Windows kernel for process tracking).
User-Mode Provider Example:
- Name: Microsoft-Windows-PowerShell
- GUID: {A0C1853B-5C40-4B15-8766-3CF1C58F985A}
- This is the primary provider for PowerShell activity. It generates detailed events for pipeline execution, command invocation, and script block logging. It is a fundamental source for security monitoring on modern Windows systems.
Kernel-Mode Provider Example:
- Name: Microsoft-Windows-Kernel-Process
- GUID: {22FB2CD6-0E7B-422B-A0C7-2FAD1FD0E716}
- This provider emits low-level kernel events related to process and thread activity. It’s used to log process creation, process termination, thread creation, and thread termination (e.g., Event ID 1 for Process Create).
ETW supports four types of providers:
- MOF Providers: Use Managed Object Format (MOF) schemas to define event structures. They are flexible and widely used for various event types.
- WPP Providers: Utilize Windows Software Trace Preprocessor macros in source code for low-level kernel-mode tracing and debugging.
- Manifest-based Providers: Rely on XML manifest files to define event structures, offering flexibility and ease of customization.
- TraceLogging Providers: Use the TraceLogging API for simplified, efficient event generation with minimal code overhead, introduced in newer Windows versions.
Example with Logman
Provider: Microsoft-Windows-Kernel-Process (tracks process-related events, such as process creation/termination).
Command: Use logman to query available providers and verify the provider’s existence.
Run Command Prompt/PowerShell as admin.
logman query providers
Output: Lists all providers, including:
Microsoft-Windows-Kernel-Process {22FB2CD6-0E7B-422B-A0C7-2FAD1FD0E716}
Command: Inspect details of a specific provider.
Command Structure:
logman query providers "<ProviderNameOrGUID>"
Example Command:
logman query providers "Microsoft-Windows-Kernel-Process"
Controller
A controller is an application that manages ETW sessions. It creates, starts, and stops sessions. It chooses where logs are saved and how the log file is handled. It enables or disables providers so they can send events to a session. It sets the size and number of buffers, which are temporary storage for events. It reports session statistics such as buffers used, buffers delivered to consumers, and events or buffers lost. These controls keep event collection efficient for live viewing or later analysis. Examples include Logman, Tracelog, Windows Performance Recorder, and custom ETW control programs.
Two controller modes with Logman:
Ad-hoc ETW session (
-ets): Create = Start now. In-memory, temporary. Stopping removes the session.Persisted Data Collector Set (DCS): Saved configuration (on disk/registry). Requires explicit
start/stop. Reusable.
Example with Logman: Ad-hoc ETW Session (-ets)
Scenario: Create and manage an ad-hoc session named “MySession” to collect events from the Microsoft-Windows-Kernel-Process provider
Create Output Directory: Create C:\Logs folder before running commands.
Command: Create and start a trace session named “MySession” as an ETW session and enable the provider “Microsoft-Windows-Kernel-Process”.
logman create trace MySession -p "Microsoft-Windows-Kernel-Process" 0x10 5 -o C:\Logs\MySession.etl -ets
-p: Specifies the provider (in quotes due to hyphens) with keywords (0x10 for process events) and level (5 for informational).
-o: Sets the output .etl file path.
-ets: Creates and starts an active ETW session visible in logman query -ets.
Note: When using -ets, you don’t need to run logman start separately. The session starts immediately upon creation and disappears from memory when stopped. Because it’s temporary, logman delete MySession -ets isn’t required.
Command: Verify session details and statistics.
logman query MySession -ets
Output: Displays buffer usage, events logged, and any lost events.
Command: List all active trace sessions.
logman query -ets
In the list you will see the created “MySession” session.
Command: Stop the session after collecting events.
logman stop MySession -ets
Once stopped, the session is deleted automatically (cannot be restarted or deleted again). The -ets flag creates an ad-hoc session in memory, which is removed upon stopping, making logman delete MySession -ets optional.
Output:
Check C:\Logs\MySession.etl — it contains recorded process activity.
Explanation: The controller configures the session, enables the provider, and manages event collection. The -ets flag can be used with logman query to list all active trace sessions.
Example with Logman: Data Collector Set (DCS)
A DCS is a reusable session stored permanently. You can start and stop it multiple times; it’s visible under logman query.
Scenario: Create and manage a persisted ETW trace session (“MySessionDCS”) for Microsoft-Windows-Kernel-Process events.
Command: Create a trace session as a DCS.
logman create trace MySessionDCS -p "Microsoft-Windows-Kernel-Process" 0x10 5 -o C:\Logs\MySessionDCS.etl
Command: Start the session.
logman start MySessionDCS
Command: Verify session details and statistics.
logman query MySessionDCS
Command: List all active trace sessions.
logman query
Command: Stop the session after collecting events.
logman stop MySessionDCS
Command: Start the session again just to show it can be started and stopped.
logman start MySessionDCS
Command: Delete the created trace session (MySessionDCS):
1. First stop the trace session (MySessionDCS):
logman stop MySessionDCS
2. Now Delete the MySession
logman delete MySessionDCS
Output: Confirms the session is stopped and the DCS configuration is deleted.
Explanation: The DCS session is persisted and requires explicit start/stop commands without -ets. Deletion removes the stored configuration. Use quotes for provider names with hyphens. Run as Administrator to avoid errors.
Without -ets, the session is a persisted DCS, stored as a configuration. Use logman start/stop (e.g. logman start MySessionDCS) without -ets for DCS sessions. Run as Administrator to avoid errors.
Session
A session is a container that collects events from one or more providers. It uses buffers to hold incoming events, applies filters based on level or keywords to decide what to keep, and then either streams events in real time to consumers for live analysis, writes them to an etl Event Trace Log file for later review, or does both. Examples of consumers include PerfView, xperf, and custom ETW applications.
Example: Inspecting Ad-hoc ETW Session (-ets)
The Controller (logman) is the tool that creates the session. The Session is the object that gets created. We can see this by querying the properties of the “MySession”.
Scenario: Inspect and modify properties of the “MySession” session created in the Controller example.
Command: Create and start the session (referenced from Controller).
logman create trace MySession -p "Microsoft-Windows-Kernel-Process" 0x10 5 -o C:\Logs\MySession.etl -ets
Command: Query session properties.
logman query MySession -ets
Output:
C:\Windows\system32>logman query MySession -ets

Name:                 MySession
Status:               Running
Root Path:            C:\Logs
Segment:              Off
Schedules:            On

Name:                 MySession\MySession
Type:                 Trace
Output Location:      C:\Logs\MySession.etl
Append:               Off
Circular:             Off
Overwrite:            Off
Buffer Size:          8
Buffers Lost:         0
Buffers Written:      1
Buffer Flush Timer:   0
Clock Type:           Performance
File Mode:            File

Provider:
Name:                 Microsoft-Windows-Kernel-Process
Provider Guid:        {22FB2CD6-0E7B-422B-A0C7-2FAD1FD0E716}
Level:                5
KeywordsAll:          0x0
KeywordsAny:          0x10 (WINEVENT_KEYWORD_PROCESS)
Properties:           64
Filter Type:          0
Consumer
A consumer is a tool or application that reads and analyzes events collected by an ETW session. It can process events in real time or from saved .etl files to display, filter, or interpret data. Examples include PerfView, Windows Performance Analyzer, xperf, and custom ETW analysis tools. Some ETW providers also write to Windows Event Log channels, which can be viewed using Event Viewer. However, Event Viewer does not read directly from ETW sessions. Consumers are also known as subscribers.
Channel
A Channel in Event Tracing for Windows (ETW) is a named destination managed by the Windows Event Log service. This named destination is a human-readable identifier (like Microsoft-Windows-PowerShell/Operational) for a persistent storage location where providers send specific events. Basically Microsoft-Windows-PowerShell/Operational is a channel name. Instead of routing events to a complex identifier, providers simply target the channel’s clear name, allowing for easy access and storage of events. Channels are organized pipelines that collect events and save them to .evtx files, usually in C:\Windows\System32\winevt\Logs.
In a nutshell, A channel is a Windows Event Log destination where events are stored by the Windows Event Log service. Providers can publish selected ETW events to a channel. These events are stored in special .evtx files that can be opened with tools such as Event Viewer and PowerShell. Additionally, The events can also be accessed via applications that interface with the Windows Event Log service, including log aggregators such as Splunk and Wazuh, as well as custom software built on Windows APIs.
List all channels:
Get-WinEvent -ListLog * | Select-Object LogName, IsEnabled, MaximumSizeInBytes
Show details for the PowerShell Operational channel:
Get-WinEvent -ListLog "Microsoft-Windows-PowerShell/Operational" |
  Format-List *
Read recent events from a channel:
Get-WinEvent -LogName "Microsoft-Windows-PowerShell/Operational" -MaxEvents 50
Here’s how you can view the Microsoft-Windows-PowerShell/Operational log in the Event Viewer GUI:
Open Event Viewer, Then go to:
Event Viewer → Applications and Services Logs → Microsoft → Windows → PowerShell → Operational
That’s the graphical equivalent of the channel Microsoft-Windows-PowerShell/Operational.
Every event in Windows has two key relationships:
- It is generated by a provider
- It is stored in a channel
So in the XML (or “Details → XML” view) of an event:
- Provider identifies who created the event — in your example,
Microsoft-Windows-PowerShell - Channel identifies where the event was stored — in your example,
Microsoft-Windows-PowerShell/Operational
So the provider emits the event, and the channel stores it.
That’s why the XML always lists:
<Provider Name="Microsoft-Windows-PowerShell" ... />
<Channel>Microsoft-Windows-PowerShell/Operational</Channel>
Not all ETW events are sent to channels. ETW is a flexible framework, and events that aren’t sent to channels are handled differently, depending on the configuration of the ETW session. Here’s what happens to these events:
- Captured by ETW Sessions for Real-Time Processing:
If an event isn’t directed to a channel, it’s typically handled by an ETW session configured to capture it. Sessions can send these events to real-time consumers, such as tools like PerfView, xperf, or custom ETW applications, for live analysis. For example, a developer might use PerfView to monitor performance events in real time during a stress test. Real-time events are not necessarily stored persistently unless the session is configured to save them.
- Saved to ETL Files:
If a session is configured to log events to a file, events not sent to channels are written to an ETL (Event Trace Log) file (e.g., trace.etl) instead of an .evtx file.
ETL files are temporary or analysis-focused logs that can be opened later using tools like Windows Performance Analyzer (WPA) or PerfView for post-processing. Unlike .evtx files, ETL files are not managed by the Event Log service and are not directly viewable in Event Viewer.
- Filtered Out or Ignored: Some events are Filtered Out or Ignored. For example, if a session is configured to collect only “error” events from a provider, “informational” events might be ignored entirely.
Example Scenario
- Channel Event: A provider logs a failed login attempt to the Security channel. This event is saved in Security.evtx and can be viewed in Event Viewer or queried via PowerShell for auditing.
- Non-Channel Event: A provider logs detailed CPU usage events to an ETW session for performance analysis. The session streams these events to PerfView for real-time monitoring or saves them to a trace.etl file. These events don’t go to a channel and aren’t visible in Event Viewer unless explicitly routed there.
ETL (Event Trace Log) Files:
Although ETW is a real-time framework for generating, collecting, and organizing events, it can also save them to disk for offline analysis in ETL (Event Trace Log) files with the .etl extension.
.etl vs .evtx file
.etl files are trace logs made by ETW sessions for analysis (opened with WPA or PerfView, not shown in Event Viewer), while .evtx files are the regular Windows Event Log channel logs managed by the Event Log service and viewable in Event Viewer or PowerShell (usually in C:\Windows\System32\winevt\Logs).
Channels vs. Sessions: Where Do Events Go?
Channels are for storing events long-term in .evtx files, mainly for tools like Event Viewer, PowerShell, or other log analysis software. Events not sent to channels are handled by ETW sessions, which either stream them to tools like PerfView for real-time use, save them to .etl files for later analysis, or discard them if they don’t match filters. If no session or channel is set up to capture a provider’s events, those events are never generated. This flexibility lets ETW support both persistent logging (via channels) and temporary tracing (via sessions).
Functions of Channels
Channels serve the following key functions:
- Receive Events: Channels collect events from providers through the Windows Event Log service, which processes and routes them based on the channel’s configuration.
- Store Events Persistently: Events are saved in .evtx files, ensuring they are available for later review, even after system restarts.
- Expose Events to Tools: Channels make events accessible to tools like Event Viewer, PowerShell, or third-party applications for monitoring, analysis, or reporting.
- Control Access: Channels use security descriptors to restrict access, ensuring only authorized users can view or manage the logged events.
The Two Main Channel Categories
Windows Logs:
This is the high-level category for system-wide events. It includes the five “classic” event logs that have been in Windows for a long time.
- Application: Events reported by applications or programs.
- Security: Events related to security, such as logon attempts and resource access.
- System: Events from Windows system components, like drivers and services.
- Setup: Events related to application and Windows installation/updates.
- Forwarded Events: Events collected from other computers on the network.
Applications and Services Logs:
This category contains a much larger number of logs from individual applications and components (like PowerShell, Task Scheduler, or specific hardware drivers). These logs are built using the four channel types described below.
Types of Channels
ETW channels are categorized based on their purpose and audience:
- Admin: Captures high-priority events, such as errors or critical system issues, intended for system administrators to monitor and troubleshoot operational problems.
- Operational: Logs routine diagnostic events related to system or application behavior, useful for ongoing monitoring.
- Analytic: Collects high-volume, detailed events for in-depth performance analysis or debugging, often hidden in Event Viewer unless explicitly enabled.
- Debug: Records low-level, developer-focused events for debugging during software development or testing.
By default, Event Viewer hides the Analytic and Debug channels. You can see them by clicking View > Show Analytic and Debug Logs in the Event Viewer menu.
How to List Available Providers
1. Using PowerShell
List all registered ETW providers on the system
Get-WinEvent -ListProvider *
Get Detailed Information For A Specific Provider:
View detailed information for a specific provider (e.g., PowerShell)
Get-WinEvent -ListProvider "Microsoft-Windows-PowerShell" | Format-List *
View detailed information for a specific provider (e.g., Kernel-Process)
Get-WinEvent -ListProvider "Microsoft-Windows-Kernel-Process" | Format-List *
Get Simple Information for a Specific Provider:
PowerShell Provider
Get-WinEvent -ListProvider "Microsoft-Windows-PowerShell"
Kernel-Process Provider
Get-WinEvent -ListProvider "Microsoft-Windows-Kernel-Process"
Lets Analyze the output of the command:
Get-WinEvent -ListProvider "Microsoft-Windows-PowerShell"

Output explanation:
- Name:
The name of the event provider — here it’s Microsoft-Windows-PowerShell. This identifies which component of Windows generates the events. - LogLinks:
Shows the event log channels where the provider writes its events.
- Microsoft-Windows-PowerShell/Operational: Records normal PowerShell operations and errors for troubleshooting.
- Microsoft-Windows-PowerShell/Admin: Contains administrative and high-importance events.
- Microsoft-Windows-PowerShell/Analytic: Logs detailed tracing events (usually disabled by default).
- Microsoft-Windows-PowerShell/Debug: Logs debug-level information for deep diagnostics (also usually disabled).
- Opcodes:
Lists operation codes that describe actions (for example, Start, Stop, Open, Close) within PowerShell events. - Tasks:
Shows the categories or activities that the provider can log, such as:
- CreateRunspace: When a PowerShell runspace (execution environment) is created.
- ExecuteCommand: When a PowerShell command is executed.
- Amsi: Events related to the Antimalware Scan Interface.
- Serialization: Events related to object serialization in PowerShell.
2. Using Command Prompt (logman)
List all ETW providers
logman query providers
Search for a specific provider
logman query providers | find "PowerShell"
Inspect A Specific Provider (Keywords, Levels, Processes):
logman query providers "<ProviderNameOrGUID>"
Example:
logman query providers "Microsoft-Windows-PowerShell"
Get Detailed Info For A Specific Provider:
Command Prompt (Admin):
wevtutil gp "<ProviderNameOrGUID>"
Example:
wevtutil gp "Microsoft-Windows-PowerShell"
3. Using WPR (Windows Performance Recorder)
List known system and custom providers in WPR profiles
wpr -providers
Viewing Events from a Provider
Providers don’t directly store events — they emit them to sessions or channels.
To view their events, you must query the channel they publish to or capture them in a trace.
A. Providers that Publish to Channels
If a provider writes to a Windows Event Log channel (like PowerShell does):
Get-WinEvent -LogName 'Microsoft-Windows-PowerShell/Operational' -MaxEvents 20
Or open Event Viewer → Applications and Services Logs → Microsoft → Windows → PowerShell → Operational.
B. Providers that Write to ETL Traces (via sessions)
Some providers skip Windows Event Log and send ETW data to trace sessions. Attach a provider such as Kernel Process, record to an etl file, then analyze it in Windows Performance Analyzer or PerfView. Admin rights may be required, and setting symbol paths helps produce readable call stacks.
Restricted Providers:
Some ETW providers in Windows are considered as restricted. These providers generate highly sensitive telemetry but are only accessible to processes with the proper privileges. This restriction ensures that critical system data remains protected from unprivileged access or potential threats. One of these high-value, restricted providers is Microsoft-Windows-Threat-Intelligence. However, to access this provider, processes must be privileged with a specific right, known as Protected Process Light (PPL).
- Windows does not allow arbitrary processes (i.e., processes not running as PPL) to subscribe to restricted providers, in order to prevent exposure of sensitive system data.
- Acess Requirement: Only processes running as PPL can access restricted providers.
How PPL (Protected Process Light) is implemented:
Anti-malware vendors must go through a rigorous Microsoft approval process:
- Apply to Microsoft and verify their identity.
- Sign legal agreements.
- Implement an Early Launch Anti-Malware (ELAM) driver.
- Pass testing and obtain a special Authenticode signature.
Once approved, the vendor’s antivirus runs as a PPL process, which allows it to:
- Access restricted ETW providers
- Monitor threats in real time
- Protect itself from tampering
Important points:
- PPL is not the provider itself — it’s the privileged status of the process.
- Access is tied to the signature and process mode, not just the user account.
- Even on your own PC, without a PPL process, you cannot inspect restricted providers like Microsoft-Windows-Threat-Intelligence.
Performance Monitor (GUI for ETW Sessions)
Besides command-line tools like logman and wevtutil, ETW sessions can also be viewed and managed graphically with Performance Monitor.
- Access:
- Open Start menu → search “Performance Monitor”.
- Navigate to:
Performance Monitor → Data Collector Sets → Event Trace Sessions
- Capabilities:
- Visualize Sessions: See all currently running ETW sessions.
- Session Details: Double-click a session to view its engaged providers, enabled keywords/features, and session configuration.
- Modify Sessions: Add or remove providers from an existing session.
- Create New Sessions: Use the “User Defined” category to define custom trace sessions tailored to troubleshooting or performance needs.
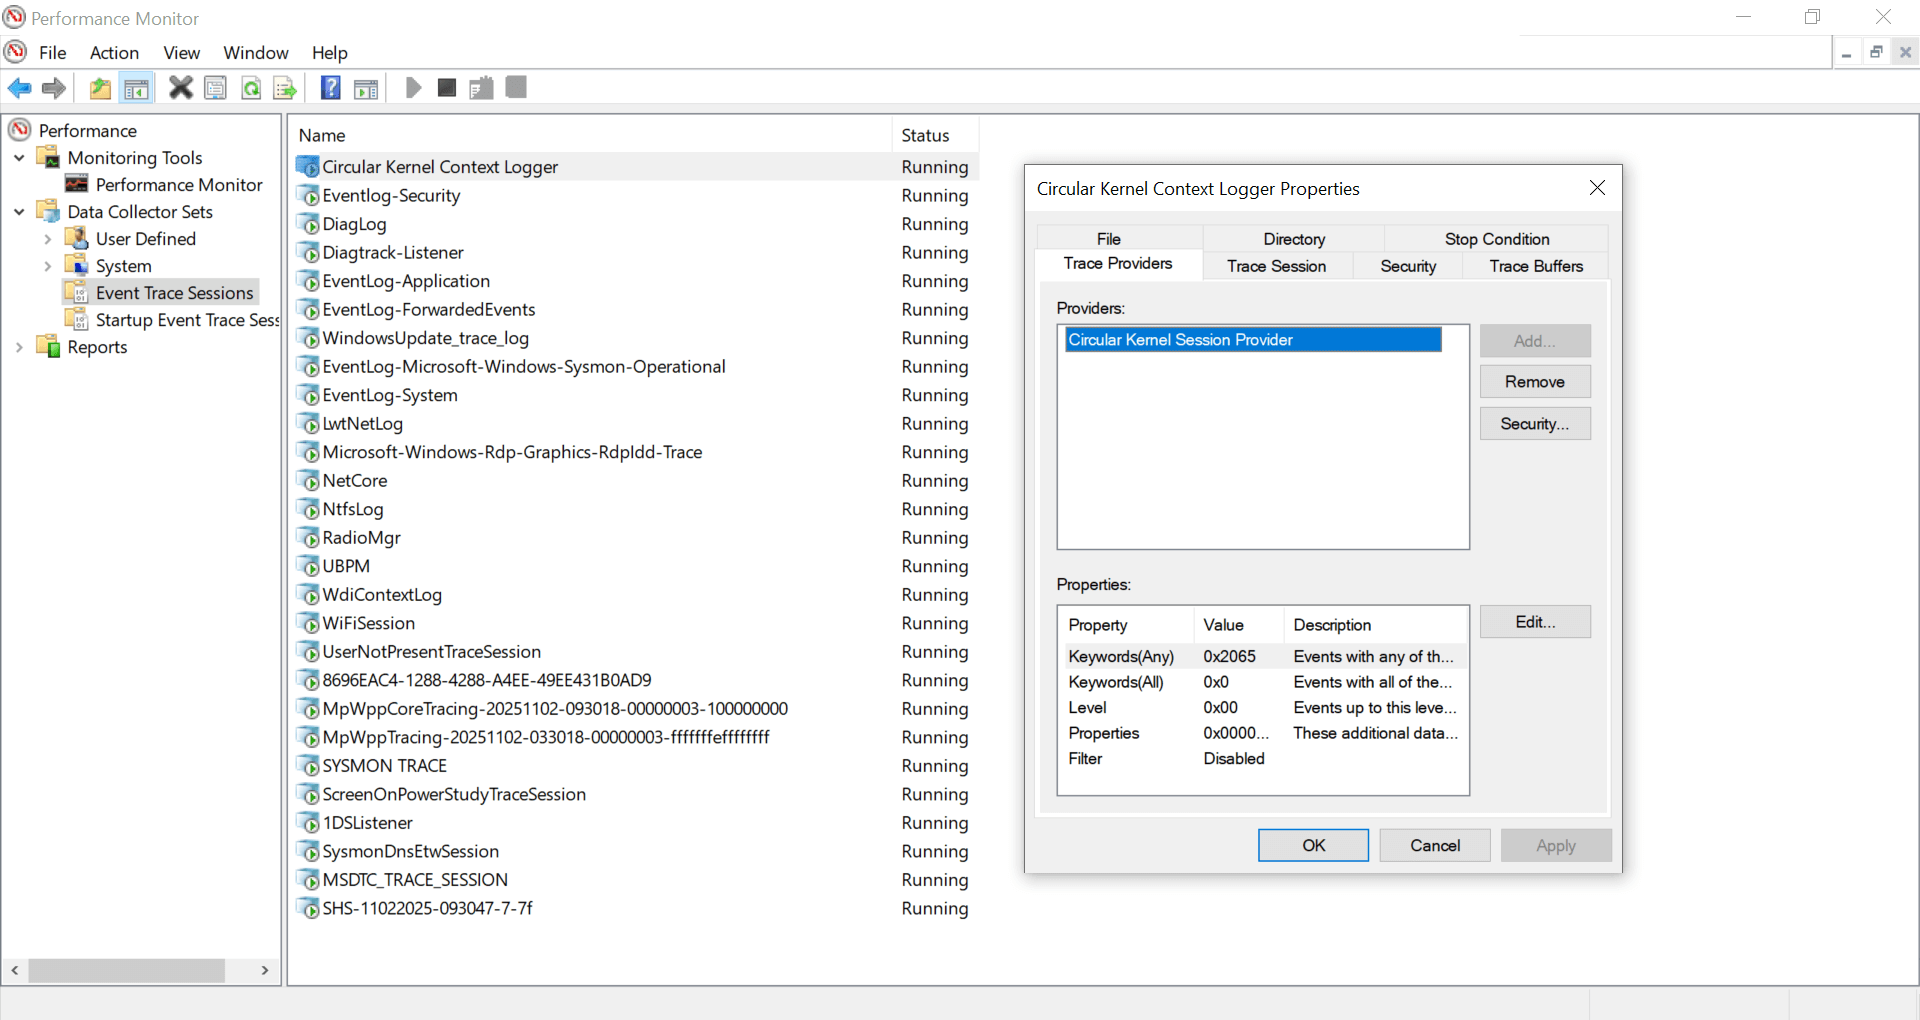
Fig: Performance Monitor – Circular Kernel Context Logger
The same output shown in the figure can also be viewed using the following command:
logman query -ets
logman query -ets "Circular Kernel Context Logger"
Event Tracing for Windows (ETW) Commands Reference
Use an elevated Command Prompt/PowerShell unless noted. Replace placeholders like <ProviderNameOrGUID>, <ChannelName>, and <SessionName> with your values.
Command Prompt (logman / wevtutil)
1. List ETW Sessions:
logman query -ets
2. List Providers:
logman query providers
3. Inspect A Specific Provider (Keywords, Levels, Processes):
logman query providers "<ProviderNameOrGUID>"
Example:
logman query providers Microsoft-Windows-Winlogon
4. Get Detailed Info For A Specific Provider:
wevtutil gp "<ProviderNameOrGUID>"
Example:
wevtutil gp "Microsoft-Windows-PowerShell"
5. List Channels (Basic):
Lists the names of all event log channels registered on the system.
wevtutil el
Output: Just the channel names (e.g. Application, System, Microsoft-Windows-PowerShell/Operational).
6. List Channels (Detailed):
Shows every channel with properties (size, path, status, record count, etc.).
PowerShell command:
Get-WinEvent -ListLog *
7. Get Properties For A Specific Channel:
wevtutil gl "<ChannelName>"
Example:
wevtutil gl "Microsoft-Windows-PowerShell/Operational"
8. See Which Sessions Use Which Providers: Map Providers ↔ Sessions
To display the providers enabled on a running ETW session, query the session by name (use quotes if it contains spaces):
logman query -ets "SessionName"
Example:
logman query -ets "Circular Kernel Context Logger"
9. Filter Providers by Name
When there are many providers, filter the list to find a specific one. This example displays only providers related to Winlogon.
logman query providers | findstr "Winlogon"
PowerShell Alternative Command:
PowerShell (Run as Admin):
1. List Sessions:
Get-EtwTraceSession *
2. List Providers:
Get-WinEvent -ListProvider * -ErrorAction SilentlyContinue
3. List Channels:
Get-WinEvent -ListLog *
4. Get Detailed Info For A Specific Provider:
Get the Main Provider Details:
Get-WinEvent -ListProvider "Microsoft-Windows-Sysmon" | Format-List *
This will give you the Name, Id (GUID), MessageFilePath, and other direct properties.
Get Channels:
To see the detailed channels for the provider, access the LogLinks property.
(Get-WinEvent -ListProvider "Microsoft-Windows-Sysmon").LogLinks
5. Get Properties For A Specific Channel:
Get-WinEvent -ListLog "<ChannelName>" | Format-List -Property *
Example:
Get-WinEvent -ListLog "Microsoft-Windows-Sysmon/Operational" | Format-List -Property *
SOC Use Case: Leveraging ETW for Security Operations
Security Operations Centers (SOCs) rely on real-time visibility and detailed telemetry to detect, investigate, and respond to cyber threats. Event Tracing for Windows (ETW) is a game-changer for SOC teams, offering granular insights into system activities that traditional logs often miss. Here’s how SOC analysts can use ETW for threat detection, incident response, and proactive monitoring:
1. Detecting Malicious Processes
- Provider: Microsoft-Windows-Kernel-Process (GUID: {22FB2CD6-0E7B-422B-A0C7-2FAD1FD0E716})
- Use Case: Identify unauthorized or suspicious process creation, such as ransomware or malware spawning new processes.
- How It Works: Configure an ETW session to capture process creation events (Event ID 1). Stream these events to a real-time consumer, like an Endpoint Detection and Response (EDR) tool, to flag anomalies (e.g., unusual parent-child process relationships).
- Example Command:
logman create trace SOCProcessTrace -p "Microsoft-Windows-Kernel-Process" 0x10 5 -o C:\Logs\SOCProcessTrace.etl -ets
- SOC Benefit: Enables rapid detection of malicious processes, reducing dwell time for threats.
2. Monitoring PowerShell Activity
- Provider: Microsoft-Windows-PowerShell (GUID: {A0C1853B-5C40-4B15-8766-3CF1C58F985A})
- Use Case: Track PowerShell commands and scripts, which are commonly abused in fileless malware attacks.
- How It Works: Enable the Microsoft-Windows-PowerShell/Operational channel to log command invocations and script block execution. Use PowerShell or SIEM tools (e.g., Splunk, Wazuh) to analyze events for suspicious activity, such as encoded commands or unusual script execution.
- Example Command:
Get-WinEvent -LogName "Microsoft-Windows-PowerShell/Operational" -MaxEvents 50 | Where-Object { $_.Id -eq 4104 }- SOC Benefit: Provides detailed telemetry for investigating PowerShell-based attacks, a favorite vector for advanced persistent threats (APTs).
3. Network Activity Monitoring
- Provider: Microsoft-Windows-TCPIP or Microsoft-Windows-NetworkProfile
- Use Case: Detect unauthorized network connections, such as command-and-control (C2) traffic from malware.
- How It Works: Configure an ETW session to capture network connection events. Stream these to a real-time consumer or save to an .etl file for correlation with threat intelligence feeds in the SOC.
- Example Command:
logman create trace SOCNetworkTrace -p "Microsoft-Windows-TCPIP" 0xFFFFFFFF 5 -o C:\Logs\SOCNetworkTrace.etl -ets
- SOC Benefit: Helps identify suspicious outbound connections, enabling faster containment of network-based threats.
4. Incident Response with ETL Files
- Scenario: A SOC team investigates a suspected breach after detecting anomalous behavior.
- How It Works: Use saved .etl files from ETW sessions to reconstruct the timeline of an attack. Tools like PerfView or Windows Performance Analyzer (WPA) can analyze process, file, registry, and network events to identify the root cause.
- Example: A SOC analyst uses PerfView to open SOCProcessTrace.etl and traces a malicious process back to its parent process and associated network activity.
- SOC Benefit: Provides forensic-grade evidence for post-incident analysis, supporting compliance and reporting.
Why ETW Is a SOC Superpower
- Granularity: Captures low-level events (e.g., system calls, thread activity) missed by standard logs.
- Real-Time Analysis: Streams events to EDR or SIEM tools for immediate threat detection.
- Scalability: Handles high-volume telemetry without overwhelming SOC infrastructure.
- Restricted Providers: Access to providers like Microsoft-Windows-Threat-Intelligence (with PPL privileges) enhances advanced threat detection for approved EDR solutions.
Pro Tip: Integrate ETW with tools like Sysmon and a SIEM platform to create a robust SOC monitoring pipeline. For deeper insights, explore Sysmon for SOC Guide https://hackersterminal.com/sysmon-setup-configuration-siem-log-forwarding-guide/.
ETW Frequently Asked Questions
Q: Is ETW better than the Windows Event Viewer?
A: They serve different purposes. Event Viewer is a simple interface for reading pre-defined logs (like .evtx files) from specific Channels (e.g., Security, System). ETW is the underlying framework that can capture a much wider and higher-volume stream of events from Providers, often in real-time or to an .etl file. Many high-frequency events (like kernel activity) are only available via ETW and never appear in Event Viewer.
Q: Can running an ETW trace slow down my computer?
A: ETW is designed to be extremely lightweight and high-performance. However, if you enable too many providers (especially verbose kernel providers) or write to a slow disk, a performance impact is possible. It’s best practice to only enable the specific providers and keywords you need for your analysis.
Q: What is the main difference between an .etl and an .evtx file?
A: An .evtx file is a persistent, structured log managed by the Windows Event Log service and viewed with Event Viewer (e.g., Security.evtx). An .etl file is a raw, high-speed binary trace log created by an ETW Session. It is not human-readable and must be parsed by a consumer like Windows Performance Analyzer (WPA) or PerfView.
Event Tracing for Windows (ETW) Summary:
Event Tracing for Windows (ETW) is a flexible, extensible, and lightweight logging framework built into Windows. Its architecture follows a publish-subscribe model:
- Controllers manage sessions.
- Providers generate events.
- Consumers receive/process events.
- Channels organize them logically.
- ETL files persist them for analysis.
This makes ETW a powerful tool for security monitoring, incident response, and performance diagnostics, providing visibility into system behavior at a depth not possible with traditional logs.
Conclusion
Event Tracing for Windows (ETW) is an essential tool for anyone looking to dive deep into Windows system behavior. From tracking security threats to optimizing performance and debugging applications, ETW provides unparalleled visibility into user-mode and kernel-mode activities. With tools like Logman, PerfView, and PowerShell, you can start leveraging ETW today to enhance your workflows.
Further Reading and References
- About Event Tracing – The primary documentation for ETW architecture.
- Logman Command Reference – Official syntax for the logman tool.
- Windows Performance Analyzer (WPA) Docs – Documentation for the main .etl analysis tool.
- Protected Process Light (PPL) API – Technical documentation on PPL.
- PerfView GitHub Repository – Official download for the PerfView analysis tool.
- Tampering with Windows Event Tracing – Foundational research by Matt Graeber on ETW vulnerabilities.
- Threat Hunting with ETW and HELK – A practical guide by Roberto Rodriguez for using ETW with a SIEM.
- EVTX-ETW-Resources GitHub – A community list of ETW providers and event IDs.


Subscribe To Our Newsletter
Join our mailing list to receive the latest news and updates from our team.
You have Successfully Subscribed!